Mozilla: 10 years

It's been a long while since I wrote Mozilla: 1 year review. I hit my 10-year "Moziversary" as an employee on September 6th. I was hired in a "doubling" period of Mozilla, so there are a fair number of people who are hitting 10 year anniversaries right now. It's interesting to see that even though we're all at the same company, we had different journeys here.

I started out as a Software Engineer or something like that. Then I was promoted to Senior Software Engineer and then Staff Software Engineer. Then last week, I was promoted to Senior Staff Software Engineer. My role at work over time has changed significantly. It was a weird path to get to where I am now, but that's probably a topic for another post.

I've worked on dozens of projects in a variety of capacities. Here's a handful of the ones that were interesting experiences in one way or another:

  • SUMO (support.mozilla.org): Mozilla's support site

  • Input: Mozilla's feedback site, user sentiment analysis, and Mozilla's initial experiments with Heartbeat and experiments platforms

  • MDN Web Docs: documentation, tutorials, and such for web standards

  • Mozilla Location Service: Mozilla's device location query system

  • Buildhub and Buildhub2: index for build information

  • Socorro: Mozilla's crash ingestion pipeline for collecting, processing, and analyzing crash reports for Mozilla products

  • Tecken: Mozilla's symbols server for uploading and downloading symbols and also symbolicating stacks

  • Standup: system for reporting and viewing status

  • FirefoxOS: Mozilla's mobile operating system

I also worked on a bunch of libraries and tools:

  • siggen: library for generating crash signatures using the same algorithm that Socorro uses (Python)

  • Everett: configuration library (Python)

  • Markus: metrics client library (Python)

  • Bleach: sanitizer for user-provided text for use in an HTML context (Python)

  • ElasticUtils: Elasticsearch query DSL library (Python)

  • mozilla-django-oidc: OIDC authentication for Django (Python)

  • Puente: convenience library for using gettext strings in Django (Python)

  • crashstats-tools: command line tools for accessing Socorro APIs (Python)

  • rob-bugson: Firefox addon that adds Bugzilla links to GitHub PR pages (JS)

  • paul-mclendahand: tool for combining GitHub PRs into a single branch (Python)

  • Dennis: gettext translated strings linter (Python)

I was a part of things:

I've given a few presentations [1]:

I've left lots of FIXME notes everywhere.

I made some stickers:

/images/soloist_2017_handdrawn.thumbnail.png

"Soloists" sticker (2017)

/images/ted_sticker.thumbnail.png

"Ted maintained this" sticker (2019)

I've worked with a lot of people and created some really warm, wonderful friendships. Some have left Mozilla, but we keep in touch.

I've been to many work weeks, conferences, summits, and all hands trips.

I've gone through a few profile pictures:

/images/profile_2011.thumbnail.jpg

Me in 2011

/images/profile_2013.thumbnail.jpg

Me in 2013

/images/profile_2016.thumbnail.jpg

Me in 2016 (taken by Erik Rose in London)

/images/profile_2021.thumbnail.jpg

Me in 2021

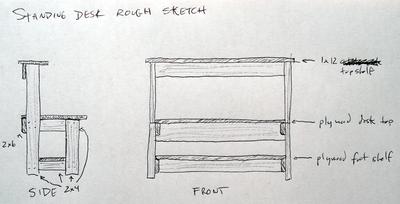
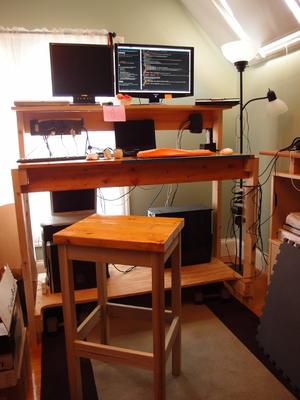
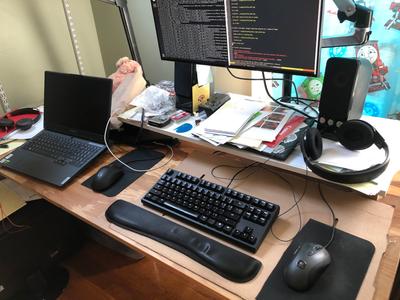
I've built a few desks, though my pictures are pretty meagre:

/images/standing_desk_rough_sketch.thumbnail.jpg

Rough sketch of a standing desk

/images/standing_desk_1.thumbnail.jpg

Standing desk and a stool I built

/images/desk_2021.thumbnail.jpg

My current chaos of a desk

I've written lots of blog posts on status, project retrospectives, releases, initiatives, and such. Some of them are fun reads still.

It's been a long 10 years. I wonder if I'll be here for 10 more. It's possible!

Socorro Overview: 2021, presentation

Socorro became part of the Data Org part of Mozilla back in August 2020. I had intended to give this presentation in October 2020 after I had given one on Tecken [1], but then the team I was on got re-orged and I never got around to redoing the presentation for a different group.

Fast-forward to March. I got around to updating the presentation and then presented it to Data Club on March 26th, 2021.

I was asked if I want it posted on YouTube and while that'd be cool, I don't think video is very accessible on its own [2]. Instead, I decided I wanted to convert it to a blog post. It took a while to do that for various reasons that I'll cover in another blog post.

This blog post goes through the slides and narrative of that presentation.

Read more…

Data Org Working Groups: retrospective (2020)

Project

time:

1 month

impact:

established cross organization groups as a tool for grouping people

Problem statement

Data Org architects, builds, and maintains a data ingestion system and the ecosystem of pieces around it. It covers a swath of engineering and data science disciplines and problem domains. Many of us are generalists and have expertise and interests in multiple areas. Many projects cut across disciplines, problem domains, and organizational structures. Some projects, disciplines, and problem domains benefit from participation of other stakeholders who aren't in Data Org.

In order to succeed in tackling the projects of tomorrow, we need to formalize creating, maintaining, and disbanding groups composed of interested stakeholders focusing on specific missions. Further, we need a set of best practices to help make these groups successful.

Read more…

Markus v3.0.0 released! Better metrics API for Python projects.

What is it?

Markus is a Python library for generating metrics.

Markus makes it easier to generate metrics in your program by:

  • providing multiple backends (Datadog statsd, statsd, logging, logging roll-up, and so on) for sending metrics data to different places

  • sending metrics to multiple backends at the same time

  • providing testing helpers for easy verification of metrics generation

  • providing a decoupled architecture making it easier to write code to generate metrics without having to worry about making sure creating and configuring a metrics client has been done--similar to the Python logging module in this way

We use it at Mozilla on many projects.

v3.0.0 released!

I released v3.0.0 just now. Changes:

Features

  • Added support for Python 3.9 (#79). Thank you, Brady!

  • Changed assert_* helper methods on markus.testing.MetricsMock to print the records to stdout if the assertion fails. This can save some time debugging failing tests. (#74)

Backwards incompatible changes

  • Dropped support for Python 3.5 (#78). Thank you, Brady!

  • markus.testing.MetricsMock.get_records and markus.testing.MetricsMock.filter_records return markus.main.MetricsRecord instances now.

    This might require you to rewrite/update tests that use the MetricsMock.

Where to go for more

Changes for this release: https://markus.readthedocs.io/en/latest/history.html#february-5th-2021

Documentation and quickstart here: https://markus.readthedocs.io/en/latest/index.html

Source code and issue tracker here: https://github.com/willkg/markus/

Let me know how this helps you!

Socorro: This Period in Crash Stats: Volume 2021.1

New features and changes in Crash Stats

Crash Stats crash report view pages show Breadcrumbs information

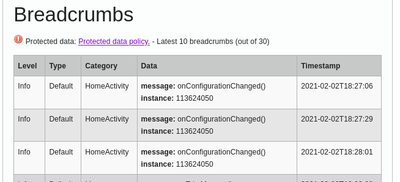
In 2020q3, Roger and I worked out a new Breadcrumbs crash annotation for crash reports generated by the android-components crash reporter. It's a JSON-encoded field with a structure just like the one that the sentry-sdk sends. Incoming crash reports that have this annotation will show the data on the crash report view page to people who have protected data access.

/images/tpics_2021_1_breadcrumbs.thumbnail.png

Figure 1: Screenshot of Breadcrumbs data in Details tab of crash report view on Crash Stats.

I implemented it based on what we get in the structure and what's in the Sentry interface.

Breadcrumbs information is not searchable with Supersearch. Currently, it's only shown in the crash report view in the Details tab.

Does this help your work? Are there ways to improve this? If so, let me know!

This work was done in [bug 1671276].

Crash Stats crash report view pages show Java exceptions

For the longest of long times, crash reports from a Java process included a JavaStackTrace annotation which was a big unstructured string of problematic parseability and I couldn't do much with it.

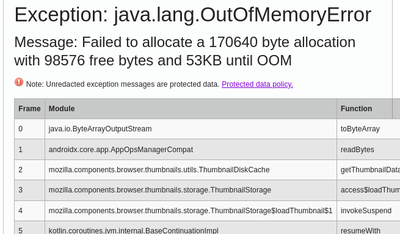
In 2020q4, Roger and I worked out a new JavaException crash annotation which was a JSON-encoded structured string containing the exception information. Not only does it have the final exception, but it also has cascading exceptions if there are any! With a structured form of the exception, we can suddenly do a lot of interesting things.

As a first step, I added display of the Java exception information to the crash report view page in the Display tab. It's in the same place that you would see the crashing thread stack if this were a C++/Rust crash.

Just like JavaStackTrace, the JavaException annotation has some data in it that can have PII in it. Because of that, the Socorro processor generates two versions of the data: one that's sanitized (no java exception message values) and one that's raw. If you have protected data access, you can see the raw one.

The interface is pretty wide and exceeds the screenshot. Sorry about that.

/images/tpics_2021_1_exception.thumbnail.png

Figure 2: Screenshot of Java exception data in Details tab of crash report view in Crash Stats.

My next step is to use the structured exception information to improve Java crash report signatures. I'm doing that work in [bug 1541120] and hoping to land that in 2021q1. More on that later.

Does this help your work? Are there ways to improve this? If so, let me know!

This work was done in [bug 1675560].

Changes to crash report view

One of the things I don't like about the crash report view is that it's impossible to intuit where the data you're looking at is from. Further, some of the tabs were unclear about what bits of data were protected data and what bits weren't. I've been improving that over time.

The most recent step involved the following changes:

  1. The "Metadata" tab was renamed to "Crash Annotations". This tab holds the crash annotation data from the raw crash before processing as well as a few fields that the collector adds when accepting a crash report from the client. Most of the fields are defined in the CrashAnnotations.yaml file in mozilla-central. The ones that aren't, yet, should get added. I have that on my list of things to get to.

  2. The "Crash Annotations" tab is now split into public and protected data sections. I hope this makes it a little clearer which is which.

  3. I removed some unneeded fields that the collector adds at ingestion.

Does this help your work? Are there ways to improve this? If so, let me know!

What's in the queue

In addition to the day-to-day stuff, I'm working on the following big projects in 2021q1.

Remove the Email field

Last year, I looked into who's using the Email field and for what, whether the data was any good, and in what circumstances do we even get Email data. That work was done in [bug 1626277].

The consensus is that since not all of the crash reporter clients let a user enter in an email address, it doesn't seem like we use the data, and it's pretty toxic data to have, we should remove it.

The first step of that is to delete the field from the crash report at ingestion. I'll be doing that work in [bug 1688905].

The second step is to remove it from the webapp. I'll be doing that work in [bug 1688907].

Once that's done, I'll write up some bugs to remove it from the crash reporter clients and wherever else it is in products.

Does this affect you? If so, let me know!

Redo signature generation for Java crashes

Currently, signature generation for Java crashes is pretty basic and it's not flexible in the ways we need it. Now we can fix that.

I need some Java crash expertise to bounce ideas off of and to help me verify "goodness" of signatures. If you're interested in helping in any capacity or if you have opinions on how it should work or what you need out of it, please let me know.

I'm hoping to do this work in 2021q1.

The tracker bug is [bug 1541120].

Closing

Thank you to Roger Yang who implemented Breadcrumbs and JavaException reporting and Gabriele Svelto who advised on new annotations and how things should work! Thank you to everyone who submits signature generation changes--I really appreciate your efforts!

Socorro Engineering: Half in Review 2020 h2 and 2020 retrospective

Summary

2020h1 was rough. 2020h2 was also rough: more layoffs, 2 re-orgs, Covid-19.

I (and Socorro and Tecken) got re-orged into the Data Org. Data Org manages the Telemetry ingestion pipeline as well as all the things related to it. There's a lot of overlap between Socorro and Telemetry and being in the Data Org might help reduce that overlap and ease maintenance.

But this post isn't about the future--it's about the past! Let's talk about what happened in 2020h2 and then a brief retrospective of 2020.

Prepare to dive in!

Read more…

Everett v1.0.3 released!

What is it?

Everett is a configuration library for Python apps.

Goals of Everett:

  1. flexible configuration from multiple configured environments

  2. easy testing with configuration

  3. easy documentation of configuration for users

From that, Everett has the following features:

  • is composeable and flexible

  • makes it easier to provide helpful error messages for users trying to configure your software

  • supports auto-documentation of configuration with a Sphinx autocomponent directive

  • has an API for testing configuration variations in your tests

  • can pull configuration from a variety of specified sources (environment, INI files, YAML files, dict, write-your-own)

  • supports parsing values (bool, int, lists of things, classes, write-your-own)

  • supports key namespaces

  • supports component architectures

  • works with whatever you're writing--command line tools, web sites, system daemons, etc

v1.0.3 released!

This is a minor maintenance update that fixes a couple of minor bugs, addresses a Sphinx deprecation issue, drops support for Python 3.4 and 3.5, and adds support for Python 3.8 and 3.9 (largely adding those environments to the test suite).

Why you should take a look at Everett

At Mozilla, I'm using Everett for a variety of projects: Mozilla symbols server, Mozilla crash ingestion pipeline, and some other tooling. We use it in a bunch of other places at Mozilla, too.

Everett makes it easy to:

  1. deal with different configurations between local development and server environments

  2. test different configuration values

  3. document configuration options

First-class docs. First-class configuration error help. First-class testing. This is why I created Everett.

If this sounds useful to you, take it for a spin. It's a drop-in replacement for python-decouple and os.environ.get('CONFIGVAR', 'default_value') style of configuration so it's easy to test out.

Enjoy!

Where to go for more

For more specifics on this release, see here: https://everett.readthedocs.io/en/latest/history.html#october-28th-2020

Documentation and quickstart here: https://everett.readthedocs.io/

Source code and issue tracker here: https://github.com/willkg/everett

Socorro Engineering: Half in Review 2020 h1

Summary

2020h1 was rough. Layoffs, re-org, Berlin All Hands, Covid-19, focused on MLS for a while, then I switched back to Socorro/Tecken full time, then virtual All Hands.

It's September now and 2020h1 ended a long time ago, but I'm only just getting a chance to catch up and some things happened in 2020h1 that are important to divulge and we don't tell anyone about Socorro events via any other medium.

Prepare to dive in!

Read more…

RustConf 2020 thoughts

Last year, I went to RustConf 2019 in Portland. It was a lovely conference. Everyone I saw was so exuberantly happy to be there--it was just remarkable. It was my first RustConf. Plus while I've been sort-of learning Rust for a while and cursorily related to Rust things (I work on crash ingestion and debug symbols things), I haven't really done any Rust work. Still, it was a remarkable and very exciting conference.

RustConf 2020 was entirely online. I'm in UTC-4, so it occurred during my afternoon and evening. I spent the entire time watching the RustConf 2020 stream and skimming the channels on Discord. Everyone I saw on the channels were so exuberantly happy to be there and supportive of one another--it was just remarkable. Again! Even virtually!

I missed the in-person aspect of a conference a bit. I've still got this thing about conferences that I'm getting over, so I liked that it was virtual because of that and also it meant I didn't have to travel to go.

I enjoyed all of the sessions--they're all top-notch! They were all pretty different in their topics and difficulty level. The organizers should get gold stars for the children's programming between sessions. I really enjoyed the "CAT!" sightings in the channels--that was worth the entrance fee.

This is a summary of the talks I wrote notes for.

Read more…

Experimenting with Symbolic

One of the things I work on is Tecken which runs Mozilla Symbols Server. It's a server that handles Breakpad symbols files upload, download, and stack symbolication.

Bug #1614928 covers adding line numbers to the symbolicated stack results for the symbolication API. The current code doesn't parse line records in Breakpad symbols files, so it doesn't know anything about line numbers. I spent some time looking at how much effort it'd take to improve the hand-written Breakpad symbol file parsing code to parse line records which requires us to carry those changes through to the caching layer and some related parts--it seemed really tricky.

That's the point where I decided to go look at Symbolic which I had been meaning to look at since Jan wrote the Native Crash Reporting: Symbol Servers, PDBs, and SDK for C and c++ blog post a year ago.

What is symbolication?

There are lots of places where stacks are interesting. For example:

  1. the stack of the crashing thread in a crash report

  2. the stacks of the parent and child processes in a hung IPC channel

  3. the stack of a thread being profiled

  4. the stack of a thread at a given point in time for debugging

"The stack" is an array of addresses in memory corresponding to the value of the instruction pointer for each of those stack frames. You can use the module information to convert that array of memory offsets to an array of [module, module_offset] pairs. Something like this:

[ 3, 6516407 ],
[ 3, 12856365 ],
[ 3, 12899916 ],
[ 3, 13034426 ],
[ 3, 13581214 ],
[ 3, 13646510 ],
...

with modules:

[ "firefox.pdb", "5F84ACF1D63667F44C4C44205044422E1" ],
[ "mozavcodec.pdb", "9A8AF7836EE6141F4C4C44205044422E1" ],
[ "Windows.Media.pdb", "01B7C51B62E95FD9C8CD73A45B4446C71" ],
[ "xul.pdb", "09F9D7ECF31F60E34C4C44205044422E1" ],
...

That's neat, but hard to work with.

What you really want is a human-readable stack of function names and files and line numbers. Then you can go look at the code in question and start your debugging adventure.

When the program is compiled, the act of compiling produces a bunch of compiler debugging information. We use dump_syms to extract the symbol information and put it into the Breakpad symbols file format. Those files get uploaded to Mozilla Symbols Server where they join all the symbols files for all the builds for the last 2 years.

Symbolication takes the array of [module, module_offset] pairs, the list of modules in memory, and the Breakpad symbols files for those modules and looks up the symbols for the [module, module_offset] pairs producing symbolicated frames.

Then you get something nicer like this:

0  xul.pdb  mozilla::ConsoleReportCollector::FlushReportsToConsole(unsigned long long, nsIConsoleReportCollector::ReportAction)
1  xul.pdb  mozilla::net::HttpBaseChannel::MaybeFlushConsoleReports()",
2  xul.pdb  mozilla::net::HttpChannelChild::OnStopRequest(nsresult const&, mozilla::net::ResourceTimingStructArgs const&, mozilla::net::nsHttpHeaderArray const&, nsTArray<mozilla::net::ConsoleReportCollected> const&)
3  xul.pdb  std::_Func_impl_no_alloc<`lambda at /builds/worker/checkouts/gecko/netwerk/protocol/http/HttpChannelChild.cpp:1001:11',void>::_Do_call()
...

Yay! Much rejoicing! Something we can do something with!

I wrote about this a bit in Crash pings and crash reports.

Tecken has a symbolication API, so you can send in a well-crafted HTTP POST and it'll symbolicate the stack for you and return it.

Quickstart with Symbolic in Python

Symbolic is a Rust crate with a Python library wrapper. The Sentry folks do a great job of generating wheels and uploading those to PyPI, so installing Symbolic is as easy as:

pip install symbolic

The Symbolic docs are terse. I found the following documentation:

That helped, but I had questions those didn't answer. I have an intrepid freshman understanding of Rust, so I ended up reading the code, tests, and examples.

The one big thing that tripped me up was that Symbolic can't parse Breakpad symbols files from a byte stream--they need to be files on disk. Tecken doesn't store Breakpad symbols files on disk--they're in AWS S3 buckets. So it downloads them and parses the byte stream. In order to use Symbolic, we'll have to adjust that to save the file to disk, then parse it, then delete the file afterwards. [1]

Anyhow, here's some sample annotated code using Symbolic to do symbol lookups:

import symbolic

# This is a Breakpad symbols file I have on disk.
archive = symbolic.Archive.open("XUL/75A79CFA0E783A35810F8ADF2931659A0/XUL.sym")

# We do debug ids as all-uppercase with no hyphens. However, symbolic
# requires that get normalized into the form it likes.
debug_id = symbolic.normalize_debug_id("75A79CFA0E783A35810F8ADF2931659A0")

# This parses the Breakpad symbols file and returns a symcache that we can
# look up addresses in.
obj = archive.get_object(debug_id=ndebug_id)
symcache = obj.make_symcache()

# Symbol lookup returns a list of LineInfo objects.
lineinfos = symcache.lookup(0xf5aa0)

print("line: %s symbol: %s" % (lineinfos[0].line, lineinfos[0].symbol))

Cool!

Symbolic parses Breakpad symbols files. It uses a cache format for fast symbol lookups. Loading the cache file is very fast.

Further, Symbolic parses files of a variety of other debug binary formats. This could be handy for skipping the intermediary Breakpad symbol file and using the debug binaries directly. More on that idea later.

Tecken is maintained by a team of two and we have other projects, so it spends a lot of time sitting in the corner feeling sad. Meanwhile, Symbolic is actively worked on by Sentry and a cadre of other contributors including Mozilla engineers because it's one of the cornerstone crates for the great Rust rewrite of Breakpad things. That's a big win for me.

So then I built a prototype

Today, I threw together a web app that does symbolication using Symbolic and called it Sherwin Syms.

https://github.com/willkg/sherwin-syms/

Building a separate prototype gives me something to tinker with that's not in production. I was able to add line number information pretty quickly. I can experiment with caching on disk. I can compare the symbolication API output for stacks between the prototype and what the Mozilla Symbols Server produces.

There's a lot of scaffolding in there. The Symbolic-using bits are in this file:

https://github.com/willkg/sherwin-syms/blob/master/src/sherwin_syms/symbols.py

Next steps

I need to integrate this into Tecken. I think that means writing a new v6 API view because the v4 and v5 code is tangled up with downloading and caching.

Markus and Gabriele suggested Tecken skip the Breakpad symbols files and use the debug binaries directly--Symbolic can handle those, too. The compelling reason for this is that Breakpad symbols files lose all the information for symbolicating inline functions correctly. I hope to look into that soon.

Summary

That summarizes the week I spent with Symbolic.